Performance Monitoring
Performance Monitoring explains how Emakin exposes telemetry and traces for operational monitoring. Use this section when you need distributed tracing, latency investigation, or runtime visibility across nodes.
Emakin exposes telemetry through OpenTelemetry and Jaeger-compatible formats.
OpenTelemetry Export
To export telemetry to an OpenTelemetry-compatible collector, set:
1 | |
For additional exporter options, use the standard OpenTelemetry OTLP exporter documentation together with your deployment configuration.
Jaeger Deployment
The documented sample command is:
1 | |
Jaeger is described as useful for:
- distributed context propagation
- distributed transaction monitoring
- root-cause analysis
- service dependency analysis
- performance and latency optimization
Trace List
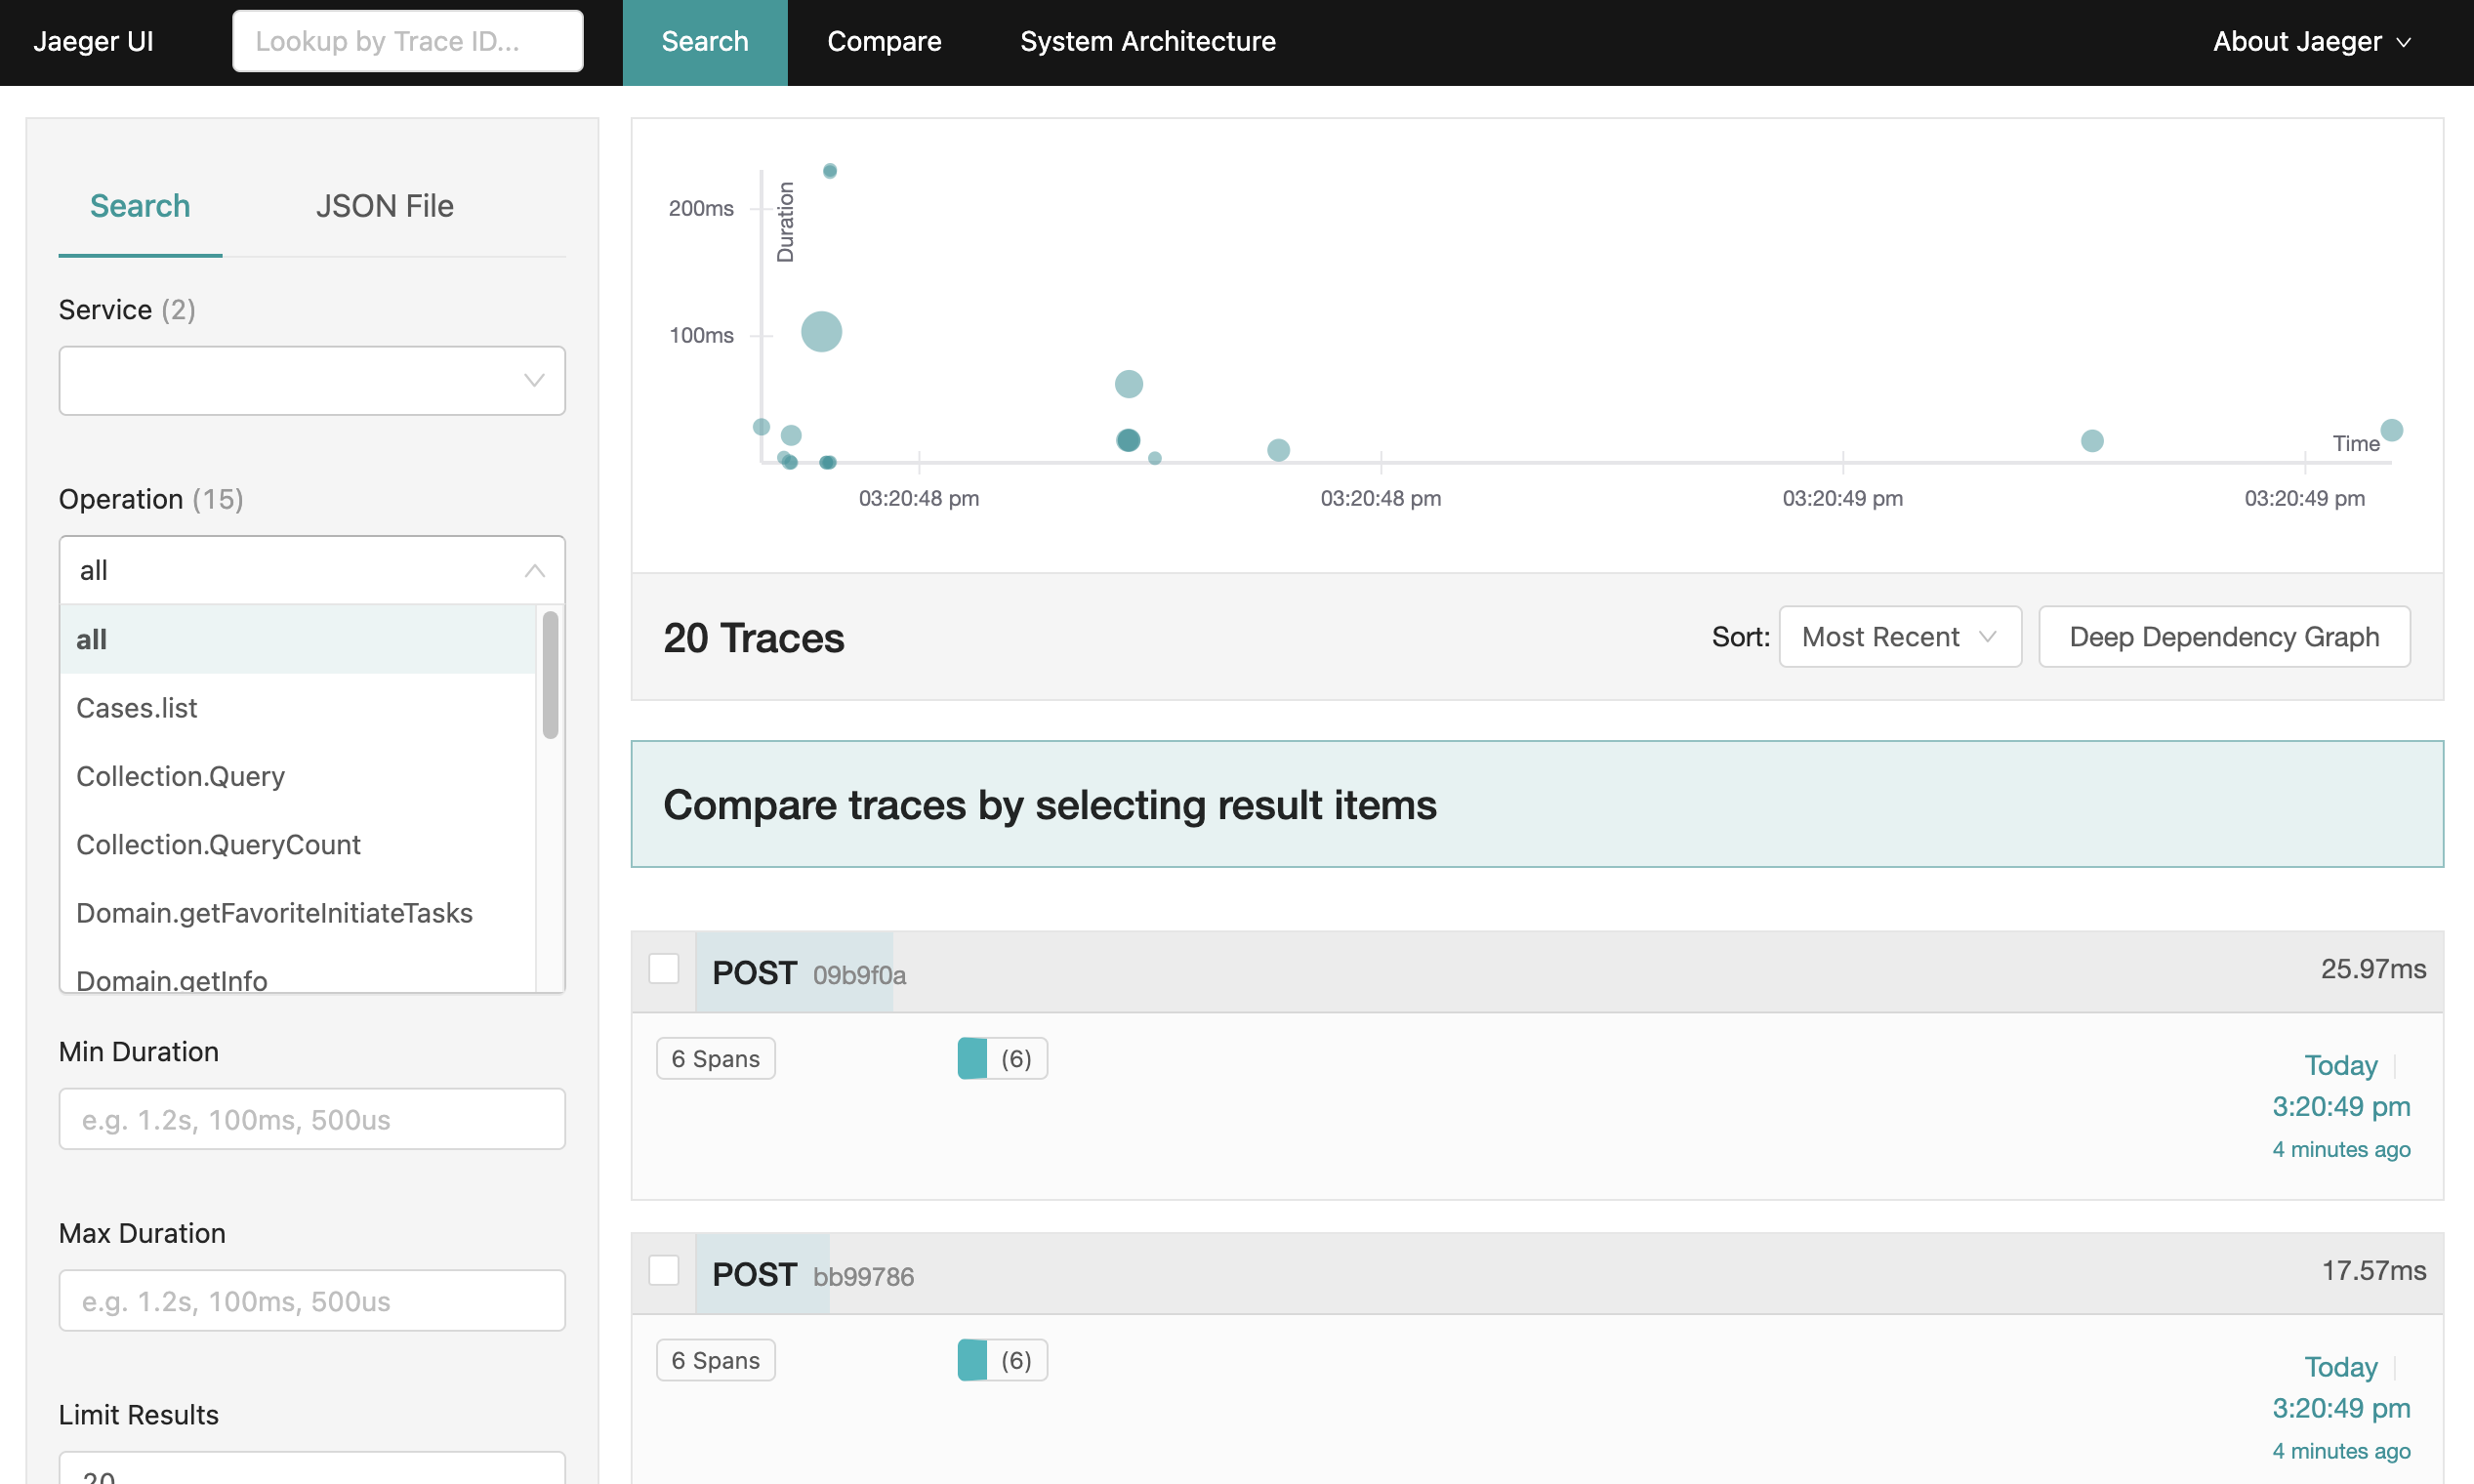
The documented Jaeger UI address is:
1 | |
The UI lists:
- Service: host names of Emakin nodes sending traces
- Operation: operations currently being traced
Trace View
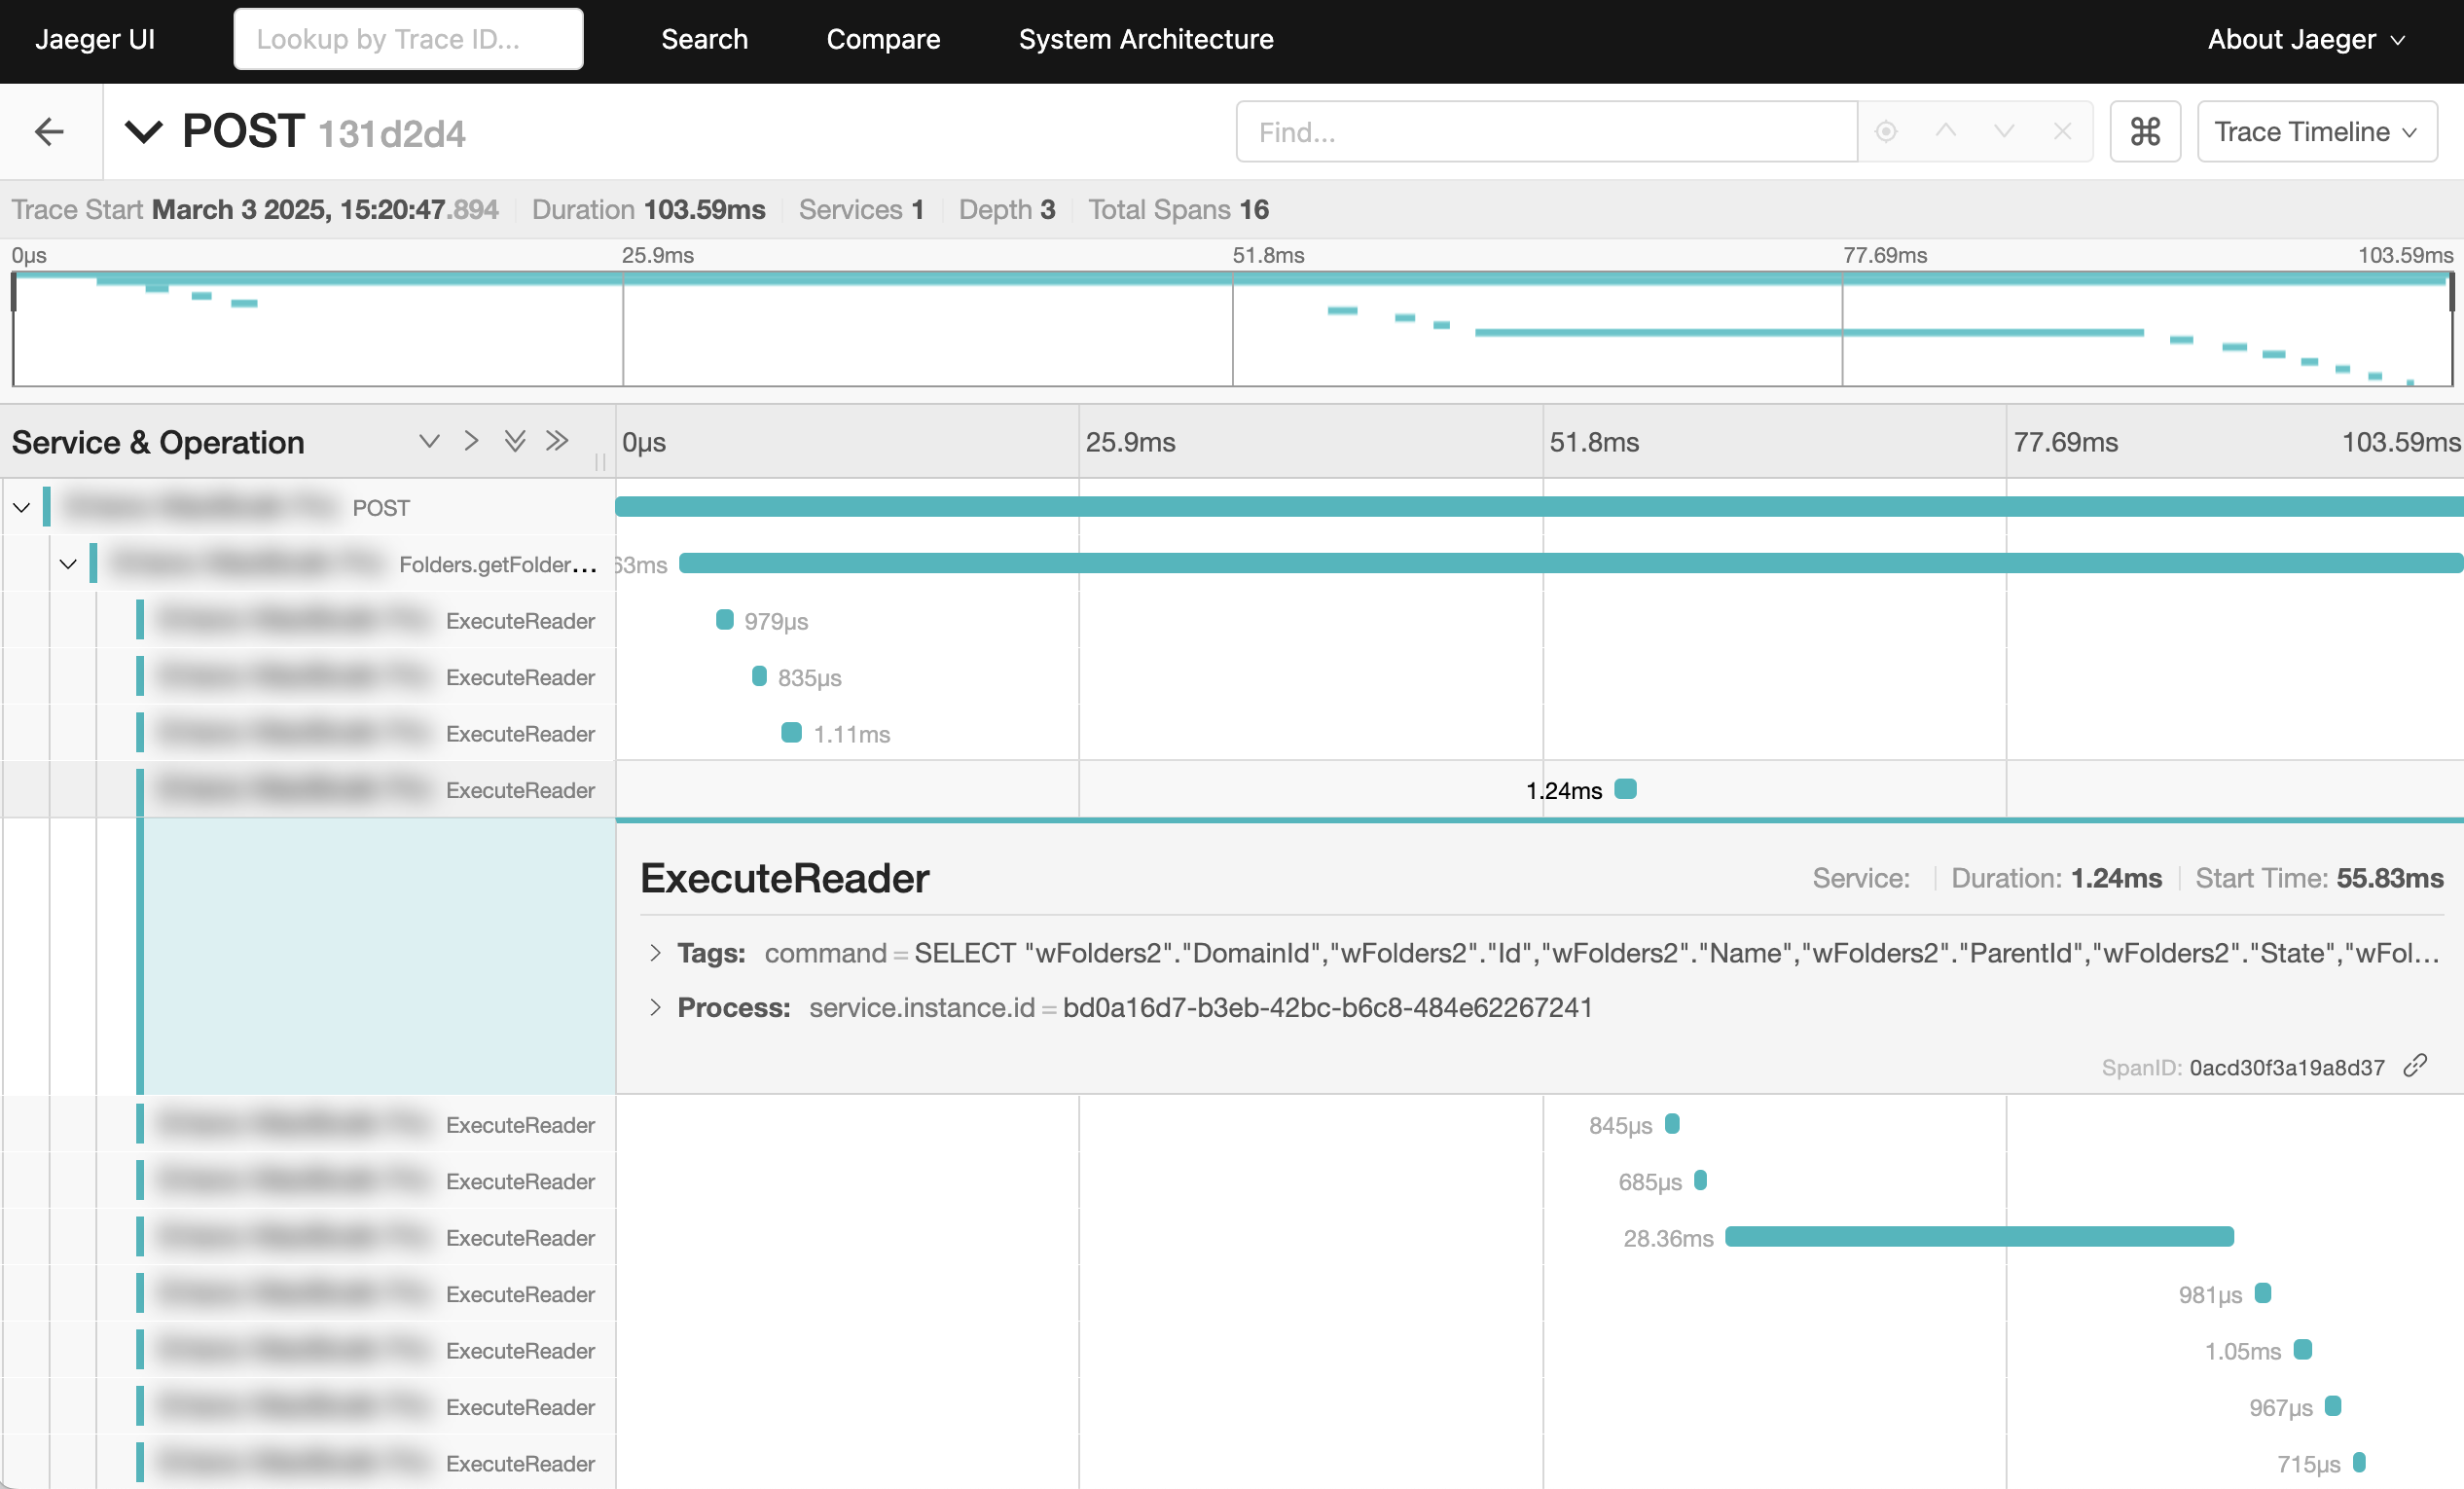
Selecting a trace shows fields such as:
- Operation Name
- Start Time
- End Time
- Duration
- Tags