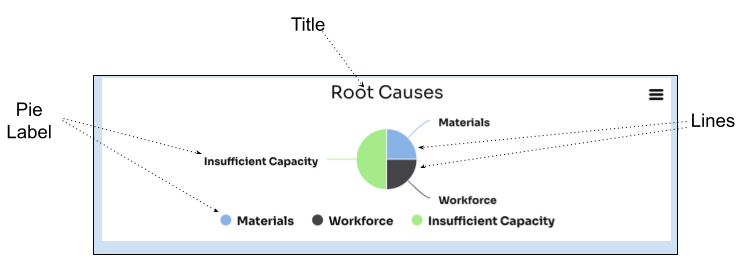
Pie Chart
The PieChart widget displays data visually as a pie chart. Data is sourced from the data model, with pie definitions specifying how data is mapped to chart elements.
Pie Definitions
A pie definition specifies a single pie within the chart. For each data element matching the XPath property, a new pie is created. The pie's value is determined by ValueXPath, and its label by LabelXPath.
To display a static label for a pie, enclose the desired label text in single quotes within the LabelXPath property. For example, to label a pie with "Sales", set LabelXPath to 'Sales'.
ValueUnitXPath is used to display the unit of the value.
XML Fields
XPathestablishes the form-data context.Width,Height, andTitle/Contentcontrol the chart frame and title.DataFormatis stored asPercentorValue. The current client rendering does not alter its output for this setting, so do not rely on it to change a slice label.- Each
Pies/Piedefines a slice source.XPathselects the rows;ValueXPathsupplies the slice value andLabelXPathsupplies its label.ValueUnitXPathis evaluated from the chart context and supplies the pie series unit.
PieChart is display-only. It reads the configured data and does not modify it.
Example
1 2 3 4 5 6 7 8 9 10 11 12 13 14 | |
1 2 3 4 5 6 7 8 9 10 11 12 13 | |
This configuration would render the following pie chart: