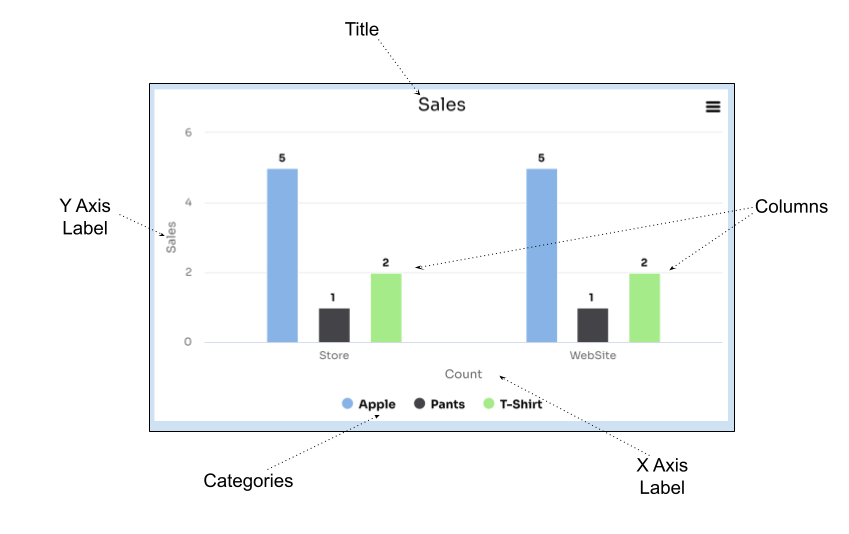
Column Chart
Vertical column chart for data visualization. Data is sourced from the data model, with column definitions specifying how data is mapped to chart elements.
Column Definitions
A column definition specifies a single column within the chart. For each data element matching the XPath property, a new column is created. The column's value is determined by ValueXPath, and its label by LabelXPath.
To display a static label for a column, enclose the desired label text in single quotes within the LabelXPath property. For example, to label a bar with "Sales", set LabelXPath to 'Sales'.
The XAxisValueFormat property defines the formatting of X-axis values as either 'Numeric' or 'Date'.
XML Fields
XPathestablishes the form-data context.Width,Height, andTitle/Contentcontrol the chart frame and title.XAxisValueFormatselectsNumericorDateformatting for the value axis.XAxisLabel/ContentandYAxisLabel/Contentsupply the axis captions.- Each
Columns/Columndefines one series.XPathselects the source collection andDataXPathselects rows within it (*selects its direct children). ValueXPath,LabelXPath, andCategoryXPathselect the value, display label, and grouping value. A quotedLabelXPathis a static label.
ColumnChart is display-only and reads these paths without changing the source data.
Example
Consider a data model representing sales data:
1 2 3 4 5 6 7 8 9 10 11 12 13 14 15 16 17 18 19 20 21 22 23 24 25 26 27 28 29 30 31 32 | |
The following BarChart configuration would render this data:
1 2 3 4 5 6 7 8 9 10 11 12 13 14 15 16 17 18 19 20 21 | |
This configuration would produce a column chart where each column represents a product, its height determined by the Count value, and labeled with the product Name, grouped by Category.